Using the Map
The main features of the map are as follows:
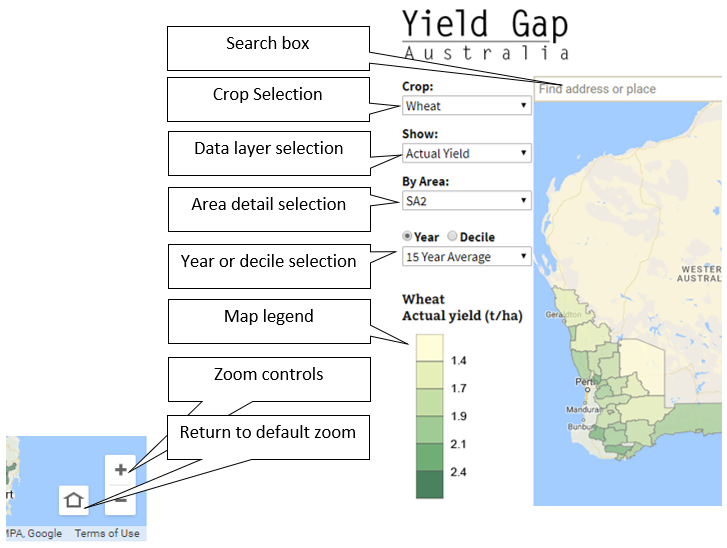
Navigating the map
There are several ways to move around the interactive map.
- To pan (slide), use your mouse to click and drag, or the arrow keys on your keyboard.
- To zoom in or out, use the + zoom button to view a smaller area, and the – zoom button to zoom out to see a larger area. Alternately, you can zoom using the mouse scroll wheel, or the + and – keys on your keyboard numeric key pad.
- To zoom the map to its initial extent, hit F5 to reload the web page
Find a place
Enter an address or keywords into the Search box at the top of the map to find locations or points of interest. Suggestions will appear as you type so you can choose a location from the list that appears. A pin will be placed at the selected location.
Selecting a layer
To view different map layers, choose from the options in the selection boxes on the left side of the map. When you choose from these boxes, the map will automatically update.
- Crop selection – change the crop for which data is displayed.
- The Data Layer selection allows you to choose from different yield layers. See the Glossary for explanations of these layers.
- The Year or Decile options:
- Select ‘Year’ to view maps for the average of all years, or for individual years.
- Select ‘Decile’ to view maps showing the yield and yield gaps divided into ten equal classes, with Decile 1 representing the lowest 10% of yields, and Decile 10 the highest 10% of yields.
- Use the Area detail selection to see the map data at different levels of detail. Data can be displayed for SA2s, GRDC Subregions and Regions.
1. Open the Compare My Farm tool
- Make sure the map is displaying Statistical Local Areas (SA2s), not GRDC Subregions or Regions.
- Locate and click on the SA2 to compare with (zoom and pan the map to find the SA2)
- Click on the SA2 to display its details. The details window will open from the selected SA2.
- In the SA2 details box, click the Compare My Farm button.
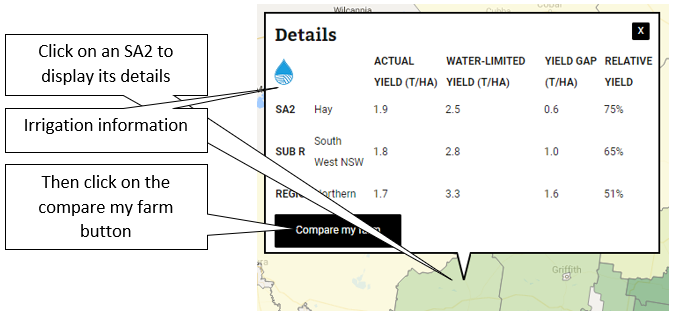
Note: The irrigation icon indicates SA2s in which irrigated cropping may affect actual yields estimates. This is a warning that the Yield Gap is probably under estimated in this SA2.
The main features of the Compare My Farm tool are:
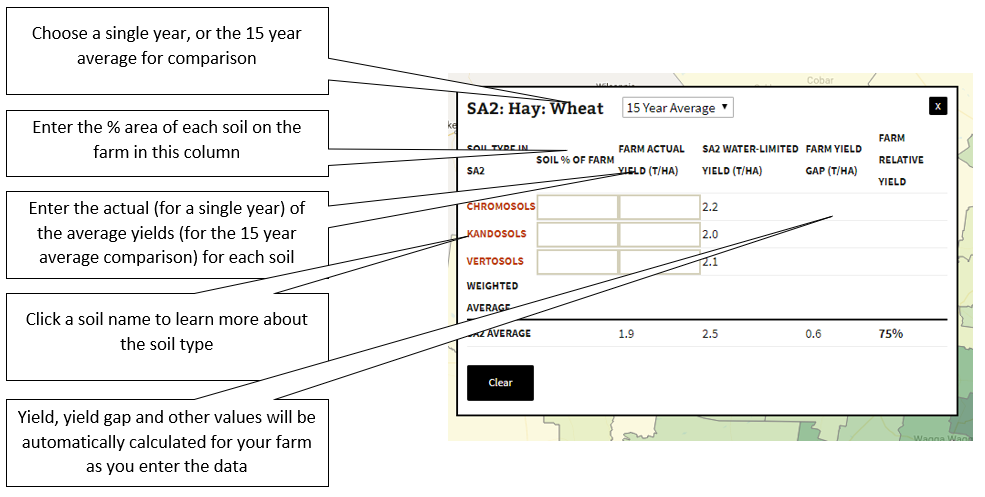
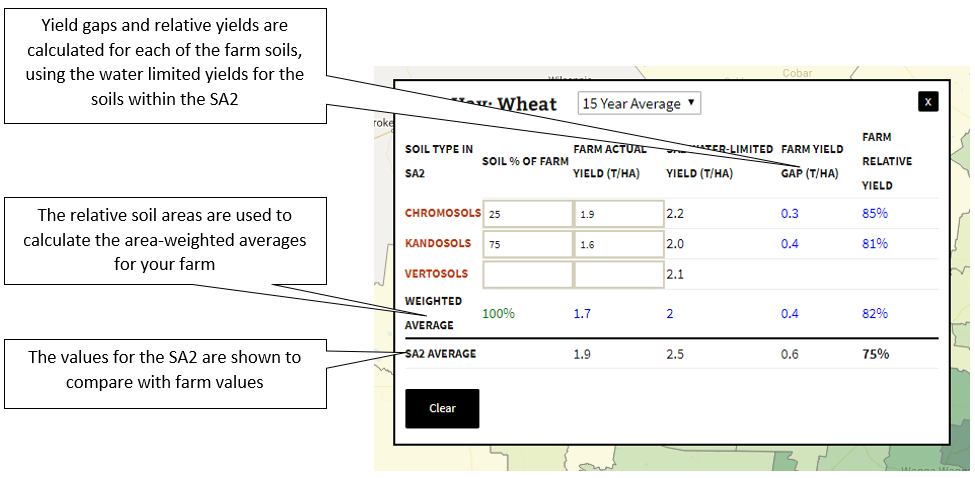
3. Enter farm specific information for each soil type that grows the selected crop on your farm
- If unsure about the soil types listed, click the soil name to learn more.
- For each of the soil types, enter the area of that soil type as a percentage of the farm.
- For each of the soils, enter the actual yields obtained for the selected year or your 15 year average yields.
- As you enter your data yields, yield gaps and relative yields will be automatically calculated.